page (1 of )

page (1 of )

You now have opened your demo trading account and invested in

While you continue monitoring your trades, it is time to study different types of investment products.

page (1 of )

Now, let’s start from understanding your open positions. If you bought the first 6 symbols from the market watch window, you will have the following positions opened.

Your open positions summary

A. Buying EURUSD, meaning you bought Euro and sold the US dollar, and therefore you make profit if Euro appreciates over the US Dollar.
B. Buying USDJPY, meaning you bought the US Dollar and sold Japanese Yen, and therefore you make profit when the US Dollar appreciates over Japanese Yen.
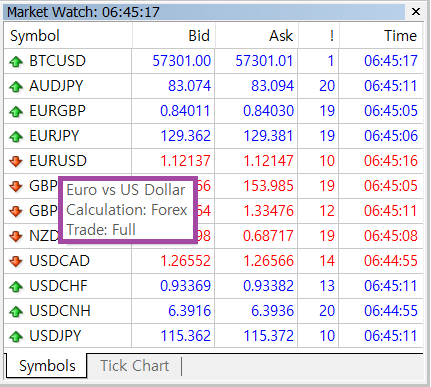
C. XAUUSD is symbol for Gold vs US Dollar. If you want to know what symbol means, just put our cursor over the symbol, to view the underlying
asset. When buying Gold and selling the US dollar, you make profit if the gold price goes up against the US dollar.
D. Buy US_OIL to profit from oil price going up.
E. Buying #NDX means you bought Nasdaq composite stock index to profit on appreciation on the stock prices of the 100 fastest growing US
companies.
F. Buying BTCUSD means you bought Bitcoin with the US Dollar expecting Bitcoin prices to appreciate.

page (1 of )

Forex trading

The foreign exchange market (Forex, FX, or currency market) is a global decentralized market for the trading of currencies. Typically, a party purchases some quantity of one currency by paying with some quantity of another currency. Each currency pair thus constitutes an individual trading product and is traditionally noted XXXYYY or XXX/YYY, where XXX and YYY are the ISO 4217 international three-letter code of the currencies involved. The first currency (XXX) is the base currency that is quoted relative to the second currency (YYY), called the counter currency (or quote currency). If the current exchange rate for EURUSD is at 1.2500, it means 1Euro is worth 1.25 US Dollar.

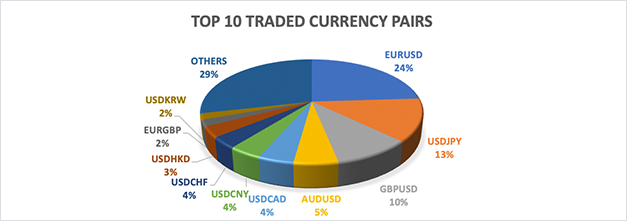
EURUSD Euro vs US dollar 24.0%
USDJPY US dollar vs Japanese yen 13.2%
GBPUSD British pound vs US dollar 9.6%
AUDUSD Australian dollar vs US dollar 5.4%
USDCAD US dollar vs Canadian dollar 4.4%
USDCNY US dollar vs Chinese renminbi 4.1%
USDCHF US dollar vs Swiss franc 3.5%
USDHKD US dollar vs Hong Kong dollar 3.3%
EURGBP Euro vs British pound 2.0%
USDKRW US dollar vs South Korean won 1.9%
OTHERS Other currency pairs 28.6%

If you put your mouse over the symbol, you can view underlying assets as seen in the below image. You are always buying the first symbol and selling the second symbol. In reserve, if you Sell EURUSD, it means you sell the Euro and buy the US Dollar.

Benefits of the Forex market

The Forex market has been referred to as the market closest to the perfect competition, as it is the most liquid financial market in the world.

  • Huge trading volume, representing the largest asset class in the world leading to high liquidity;
  • Continuous operation: 24 hours a day except for weekends, i.e., trading from 22:00 GMT on Sunday (Opening of Sydney market) until 22:00 GMT Friday (Closing of New York market);
  • Low margins of relative profit compared with other markets of fixed income; and
  • Use of leverage to enhance profit and loss margins and with respect to account size.

Fluctuations in exchange rates are usually caused by actual monetary flows as well as by expectations of changes in monetary flows. These are caused by changes in gross domestic product (GDP) growth, inflation (purchasing power parity theory), interest rates (interest rate parity, Domestic Fisher effect, International Fisher effect), budget and trade deficits or surpluses, large cross-border M&A deals and other macroeconomic conditions.

page (1 of )

Stock & Indices

Stock means shares of a company, and a single share of the stock represents ownership of the company in proportion to the entire amount of shares. Stock can be traded privately or electronically, and such transactions are normally tightly regulated by governments to protect investors and shareholders.

10 largest companies by tradable share value in the USA

Symbol Name arket Cap. (in billion dollar)
GOOG Google 1750B
MSFT Microsoft Corp. 1330B
AAPL Apple Inc. 1210B
AMZN Amazon Com Inc. 1200B
BRK Berkshire Hathaway Inc. 910B
BABA Alibaba Group 560B
FB Facebook Inc. 510B
JNJ Johnson & Johnson 400B
WMT Walmart, Inc. 370B
V Visa 350B

A stock index or stock market index is computed from the prices of selected stocks which may be classified by regions (e.g., USA, UK, and Japan) or by markets (e.g., the largest 100 company or the fastest growing companies). A ‘national’ index reflects investor sentiment on the state of its economy. The most regularly quoted market indices are national indices composed of the stocks of large companies listed on a nation’s largest stock exchanges, such as the American S&P 500, the Japanese Nikkei 225, the Indian NIFTY 50, and the British FTSE 100.

Many indices are regional, such as the FTSE Developed Europe Index or the FTSE Developed Asia Pacific Index. Indexes may be based on exchange, such as the NASDAQ-100 or NYSE US 100.

8 global stock indices reflecting the state of its economy

SPX S&P (Standard and Poor) 500 500 largest companies (mostly from USA)
NDX Nasdaq 100 100 largest companies listed in the Nasdaq exchange
WS30 Dow Jones Industrial Average 30 largest companies listed in the New York Stock Exchange
UK100 FTSE 100 Index 100 largest companies listed in the London Stock Exchange
J225 Nikkei 225 Stock Average 225 most widely quoted stock in the Tokyo Stock Exchange
GDAXI German blue-chip stock index 30 major German companies in the Frankfurt Stock Exchange
FCHI CAC 40 French stock index 40 major stocks among the 100 largest companies in Euronext Paris
HSI50 Hang Seng China 50 Index 50 major companies in the stock exchanges of Hong Kong, Shanghai and Shenzhen

page (1 of )

Precious metals trading

The prices of precious metals, including gold, silver, platinum, and palladium is driven by demand for the actual use as well as their role as investments.

Gold has been used as a relative standard for currency while gold price is driven by supply and demand, including demand as an investment asset. The total amount of gold ever mined in the world could arguably fit into a cube with sides of just 20 meters. Considering only a small amount of gold is produced annually compared to the quantity of gold minded already, gold price is moved mainly by market sentiment.

Central banks with their monetary policy play a big role in the gold price as they hold over 19% of the gold mined. It is well known among investors that gold prices are closely related to inflation and interest rate. When inflation is expected to go up with low interest rate, the price of gold tends to increase. On the other hand, the price of gold tends to depreciate if inflation is high and central banks are expected to increase interest rate. Gold and other precious metals have been used to hedge against inflation as they have no default risk.

Oil and gas trading

The role of oil in the global economy becomes greater every year as the price of oil can have a significant economic impact. Two primary factors affecting oil price are the supply and demand and the market sentiment. Many people believed there was a limited supply until 2008 when new drill technology made the middle east the second largest oil production site. Demand is highly cyclical and follows global economic trend as markets cut their oil consumption expecting recession in economy.

Political uncertainty such as war and terror has been played a small role since 2010 as supply of oil are no longer controlled by a few countries and the same time, unstable political situation which can put the oil price up will be countered by slowdown in economy due to the same political reason pushing the price of oil down.

Cryptocurrency trading

Cryptocurrencies, such as Bitcoin, is a digital asset intended to be used as a currency using distributed ledger technology called blockchain which serves as a public database outside of the central banking system. Since its inception in 2009, it has gained its position in financial market as an alternative form of payment despite of government scrutiny.

The price of cryptocurrency is highly affected by demand, which shows steady growth as a form of payment, making it more stable every year. However, the cryptocurrency market is still new and therefore sensitive to media and regulators. Positive news tends to bring more investors, while negative news and more government control over the market tends to discourage investors from speculating.

page (1 of )

Good job.

You now have a good understanding of different asset classes and how their prices are affected.

Now, it is time to watch TV.

Turn on Bloomberg or any other TV station on investment and listen to what analysts have to say about assets that you are holding.

Do not forget to read newspapers like Financial Times.

Sounds boring? Trust us, it is much more fun than you think.

With your TV or YouTube on, let us continue our lesson on analyzing different markets to find out what is causing price changes and how we can take advantage of price movements.
Introduction to market analysis

There are two approaches to market analysis:

Fundamental analysis starts from understanding that the market is not perfect. The price of an asset does not reflect the current market situation and therefore news and data are to be reviewed and studied to find the future correction in the price.

Technical analysis accepts that the market is perfect and that all news and data is already factored into the price. Therefore price, chart, trends, and patterns are used to analyze market psychology behind the price movements and the future price of an asset is forecast based on this historical price changes.

Investors can use one or both of these market analysis methodology for trading. High frequency traders often use fundamental analysis to trade on news and economic data. In general, fundamental analysis is used for longer term trading than technical analysis is used for.

Now, we will continue our lesson on fundamental analysis before you dive into technical analysis.

page (1 of )

Fundamental analysis

Fundamental analysts study historical and present data with following objectives:

  • Valuating over or under valued current market price to forecast possible price changes.
  • Evaluating previous and current performance of a company or economy to predict future performance.

Output and income

Output is the total amount that is produced and sold. The total output of a country is GDP and the output and income are the same in economics. Increase in output is seen as economic growth while the business cycles causing decrease in output is considered recession. The role of the government is to soften the recession while stabilizing growth.

Unemployment

The percentage of workers without jobs in the labor force is the unemployment rate. Economic growth leads to a higher employment while increase in unemployment confirms a sluggish economy. Nonfarm payroll data, the biggest market mover, shows employment levels excluding the farming industry since the farming industry does not reflect economy as its employment rate is cyclical based on season.

Inflation and deflation

The increase in prices of goods and services is called inflation, while the decrease in prices is called deflation. An overheated economy often incurrs inflation while a declining economy can lead to deflation. The government tries to prevent inflation and deflation by controlling money supply in the marketing using interest rate. Rapid changes in prices and interest rate can cause the market to panic.

page (1 of )

Economic policy

The Economic policy can be implemented through fiscal and monetary policy to stabilize the economy – GDP, employment, and inflation.

Monetary policy

Central banks increase the money supply by implementing quantitative easing – issuing money to buy bonds – and lowering interest rates to boost economy while decrease money supply by selling government bonds and increasing interest rate to stabilize overheated economy taking money out of circulation.

Fiscal policy

Fiscal policy is the use of tax as instruments to influence the economy. The increase in government spending, including unemployment benefits, can boost the economy while the increase in sales tax can limit the consumer spending and cool down the overheated economy. Fiscal policy is sometimes motivated by pollical reason rather than economical reason. In this case, short-term effects are the same as the monetary policy, but the long-term effects can be negative in stabilizing the economy.

page (1 of )

Evaluating current price

We will use the foreign exchange rate for the topic since the forex market has the best information equality.

Supply and demand determine the exchange rate and are usually influenced by economic factors, political conditions, and market psychology.

Economic factors

Economic factors include economic policies and economic conditions. Fiscal policy and monetary policy are economic policies while GDP, employment, and inflation are used to understand economic conditions.

  • Government budget deficits are often negative to the value of a nation’s currency.
  • Decrease in GDP and trade deficits can have a negative impact on a country’s currency.
  • Inflation can depreciate a currency, while expected increase in interest rate can appreciate the currency

Confusing? In more simple terms, you can buy the currency if there is inflation for the country only when the interest rate is low, usually less than 2% APR. It means the market has room to stabilize itself. If the interest rate is high and there is inflation, then the market is tight, and a closer monitoring is required.

  • Unexpected or more than expected decrease in Nonfarm payroll will sink the currency.

Political conditions

Investors like stable countries and companies. Buy the currency with a stable political condition and sell the currency of the nation with crisis and chaos.

page (1 of )

Market psychology

You can catch crises or avoid crisis, but either way, you need to identify market psychology. Understanding market psychology does not have to be difficult because in most cases the main part is you. What you think and what you worry are most likely what most people think and worry. Just keep the following factors when you use market psychology to trade.

Go to safe haven

When there is uncertainty in the market, move your money to a safe place. The US dollar is safe because it is the largest. The Swiss franc is safe due to the political neutrality of the nation. Gold is safe as it is the oldest currency in mankind.

Trend is your friend

The currency market is the trendiest market and often moves in visible long-term trends. Trends form patterns which is followed by many traders undergoing the same market psychology.

Buy the rumor, sell the fact

The price tends to reflect the impact of a specific event before it occurs. When the event actually happens, reverse the direction because the price is already in “oversold” or “overbought” situation.

Watch the numbers

Some economic numbers and even price levels themselves often becomes important to market psychology for you and others. If you think they will affect the market, they will most likely.

page (1 of )

What is an economic indicator?

An economic indicator is a statistic about an economic activity. Economic indicators allow for the analysis of economic performance and predictions of future performance. One application of economic indicators is the study of business cycles. Economic indicators include various indices, earnings reports, and economic summaries: for example, the unemployment rate, housing starts, consumer price index, consumer leverage ratio, industrial production, bankruptcies, gross domestic product, broadband internet penetration, retail sales, stock market prices, and money supply changes.

Economic indicators can be classified into three categories according to their usual timing in relation to the business cycle: leading indicators, lagging indicators, and coincident indicators.

page (1 of )

What are leading indicators?

Leading indicators are indicators that usually, but not always, change before the economy as a whole changes. They are therefore useful as short-term predictors of the economy. Stock market returns are a leading indicator: the stock market usually begins to decline before the economy as a whole declines and usually begins to improve before the general economy begins to recover from a slump. Other leading indicators include the index of consumer expectations, building permits, and the money supply.

The Conference Board publishes a composite Leading Economic Index consisting of ten indicators designed to predict activity in the U. S. economy six to nine months in future.

Components of the Conference Board’s Leading Economic Indicators Index

  • Average weekly hours (manufacturing) — Adjustments to the working hours of existing employees are usually made in advance of new hires or layoffs, which is why the measure of average weekly hours is a leading indicator for changes in unemployment.
  • Average weekly jobless claims for unemployment insurance — The CB reverses the value of this component from positive to negative because a positive reading indicates a loss in jobs. The initial jobless-claims data is more sensitive to business conditions than other measures of unemployment, and as such leads the monthly unemployment data released by the U.S. Department of Labor.
  • Manufacturers’ new orders for consumer goods/materials — This component is considered a leading indicator because increases in new orders for consumer goods and materials usually mean positive changes in actual production. The new orders decrease inventory and contribute to unfilled orders, a precursor to future revenue.
  • Vendor performance (slower deliveries diffusion index) — This component measures the time it takes to deliver orders to industrial companies. Vendor performance leads the business cycle because an increase in delivery time can indicate rising demand for manufacturing supplies. Vendor performance is measured by a monthly survey from the National Association of Purchasing Managers (NAPM). This diffusion index measures one-half of the respondents reporting no change and all respondents reporting slower deliveries.
  • Manufacturers’ new orders for non-defense capital goods — As stated above, new orders lead the business cycle because increases in orders usually mean positive changes in actual production and perhaps rising demand. This measure is the producer’s counterpart of new orders for consumer goods/materials component.
  • Building permits for new private housing units – This measures the strength of construction and overall economy of a nation.
  • Stock prices of 500 common stocks — Equity market returns are considered a leading indicator because changes in stock prices reflect investors’ expectations for the future of the economy and interest rates.
  • Money Supply (M2) — The money supply measures demand deposits, traveler’s checks, savings deposits, currency, money market accounts, and small-denomination time deposits. Here, M2 is adjusted for inflation by means of the deflator published by the federal government in the GDP report. Bank lending, a factor contributing to account deposits, usually declines when inflation increases faster than the money supply, which can make economic expansion more difficult. Thus, an increase in demand deposits will indicate expectations that inflation will rise, resulting in a decrease in bank lending and an increase in savings.
  • Interest rate spread (10-year Treasury vs. Federal Funds target) — The interest rate spread is often referred to as the yield curve and implies the expected direction of short-, medium- and long-term interest rates. Changes in the yield curve have been the most accurate predictors of downturns in the economic cycle. This is particularly true when the curve becomes inverted, that is, when the longer-term returns are expected to be less than the short rates.
  • Index of consumer expectations — This is the only component of the leading indicators that is based solely on expectations. This component leads the business cycle because consumer expectations can indicate future consumer spending or tightening. The data for this component comes from the University of Michigan’s Survey Research Center and is released once a month.

page (1 of )

What are lagging indicators?

Lagging indicators are indicators that usually change after the economy as a whole does. Typically, the lag is a few quarters of a year. The unemployment rate is a lagging indicator: employment tends to increase two or three quarters after an upturn in the general economy. In finance, Bollinger bands are one of various lagging indicators in frequent use. In a performance measuring system, profit earned by a business is a lagging indicator as it reflects a historical performance; similarly, improved customer satisfaction is the result of initiatives taken in the past.

The Index of Lagging Indicators is published monthly by The Conference Board, a non-governmental organization, which determines the value of the index from seven components.

The Index tends to follow changes in the overall economy.

The components on the Conference Board’s index are:

  • The average duration of unemployment (inverted)
  • The value of outstanding commercial and industrial loans
  • The change in the Consumer Price Index for services
  • The change in labor cost per unit of output
  • The ratio of manufacturing and trade inventories to sales
  • The ratio of consumer credit outstanding to personal income
  • The average prime rate charged by banks

page (1 of )

What are coincident indicators?

Coincident indicators change at approximately the same time as the whole economy, thereby providing information about the current state of the economy. There are many coincident economic indicators, such as Gross Domestic Product, industrial production, personal income and retail sales.A coincident index may be used to identify, after the fact, the dates of peaks and troughs in the business cycle.

There are four economic statistics comprising the Index of Coincident Economic Indicators:

  • Number of employees on non-agricultural payrolls
  • Personal income less transfer payments
  • Industrial production
  • Manufacturing and trade sale

The Philadelphia Federal Reserve produces state-level coincident indexes based on 4 state-level variables:

  • Nonfarm payroll employment
  • Average hours worked in manufacturing
  • Unemployment rate
  • Wage and salary disbursements deflated by the consumer price index (U.S. city average)

page (1 of )

How to trade on news and data

Understand if the news affects the market in good way or a bad way. When we say markets here, it encompasses the stock market, forex market, or any other market in which you have investment. One answer does not have to be right for all situations, meaning some news that could be good for the US dollar, but may not be good for S&P 500 US stock index.

For start, it helps listen to professional analysts explain how the market reacts to news. Then, it is your job to analyze what would investors to do based on such analysis. For example, the corona virus causes the market to crash, and the government releases cash to soften the effect. If that is the case, will the price of gold and stock index go up with surplus in cash causing inflation? Or is the government stimulus package not good enough for you to gain confidence in the market? If so, when will the market turn around?

page (1 of )

Economic Indicators

The study of interest rate, inflation, and employment allows you to understand consumers, producers, and the government.

So how do you know if the market will turn around? The first signal could come from consumers spending money on durable goods. It can also come from producers increasing its productions or from the government increasing interest rates.

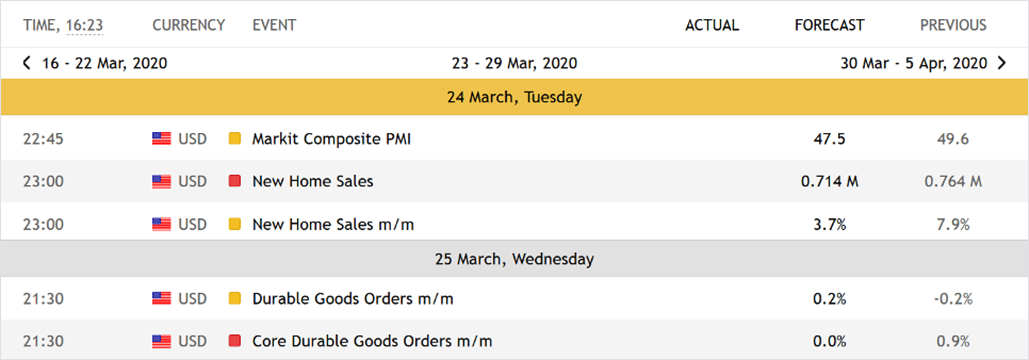
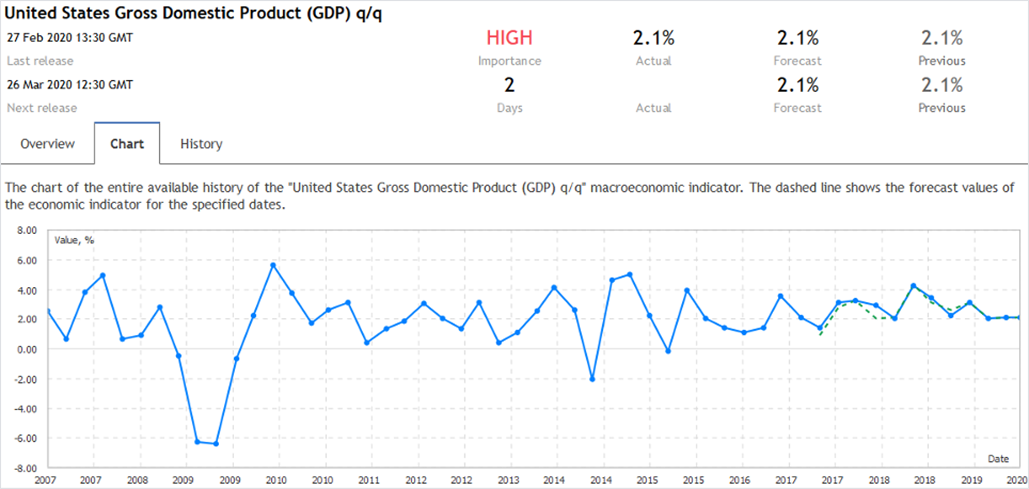
The Economic calendar shows economic data from different countries as they are released. If you double click the data from the economic calendar, you will see historical data and charts, as well as descriptions. It is always good to monitor how the market reacts to economic data as it is released.

page (1 of )

Buy on rumor and sell on fact

In the economic calendar, each data shows previous numbers with the forecasted number. In most cases, the market moves with the expectation that the actual number will be as good or bad as forecasted. For example, if GDP of the US is expected to grow by 1% this month, but the actual number is a 0.5% increase, then the market will not react positively because the positive growth in GDP was not as good as expected.

Even if the actual number for the GDP growth is 1% in line with forecast, the market may not be bullish because such an increase is already factored into the market as forecasted. If everyone is expect the market to go up, it is time to sell, since the market is already almost fully bullish and there are not more people buying into the market.

page (1 of )

Leading economic indicators

Study data from producers and consumers to forecast economic growth like GDP.

The increase in manufacturing data signals the increases in demand or the expected increase in demand. Increase in retail sales can be the sign of healthy economy as consumers are optimistic about their future. We can also look at construction data in the same way. If the market is bad and people are not expected to have more income, they will not invest in houses.

New Home Sales reflect a dollar value of sales of newly constructed residences in the United states in the given month. The value measures new single-family home sales and it is considered as a good leading indicator to forecast GDP growth.

page (1 of )

Lagging economic indicators

Study data to understand overall market conditions.

Gross Domestic Product (GDP)

The most important measure of the economy’s current health.

Unemployment Rate

It measures the percentage of people currently looking for job.

Consumer Price Index (Inflation)

It measures the increase in cost of living mostly due to growth.

Interest Rates

The best indicator for money supply and economic growth.

Fast GDP growth means more people are working to produce. More people working means more people will spend more, leading consumer prices to increase. If consumer prices increase, the value of cash depreciates, causing interest rates to increase. However, the increase in interest rates will hinder GDP growth as the cost of investing goes up with high interest. This cycle is called the business life cycle, giving us good trading opportunities.

page (1 of )

Business Life Cycle

The routinely fluctuating economic activity level from expansion and peak to recession, trough and recovery.

Expansion

Fast growing economy with strong consumer confidence followed by increase in production and employment.

Peak

The Peak is at the end of an expansion where key economic data such as employment and construction data begin to fall.

Recession

Economic activities slow down as spending stops and business confident diminishes causing increase in unemployment.

Trough

Recession is bottoming as the lowest level of economic activities are reached in recent time..

Recovery

It is period where consumers start opening their wallets and producers start investing with the expectation of expansion.

The business life cycle is especially important in trading as it is the main driver for economic events and trends. With the cycle, traders understand money supply which will then have great effect to price of different assets. In fact, most economic data follows the business life cycle while traders use such economic data to formulate entry and exit strategies for their investment.

Always remember the business life cycle and follow all major economic data releases using Economic Calendar. It is fun to watch the news, analysts’ comments, and market’s reactions when data are released.

page (1 of )

Technical Analysis

Technical Analysis is the study of applied social psychology and statistics in price action to detect trends and changes in crowd behavior.

Three principles in Technical Analysis:

Price discounts everything

All fundamental information, public or non-public, are already factored in the price.

Price moves in trends

Price does not move randomly – instead it moves in a general direction.

History repeats itself

Market psychology has repetitive patterns which is reflected in a price.

page (1 of )

Technical Analysis Types

Technical analysis can be divided into two categories, chart analysis and quantitative analysis.

  • Valuating over or under valued current market price to forecast possible price changes.
  • Evaluating previous and current performance of a company or economy to predict future performance.

Chart Analysis

Study trend lines to detect support and resistance for price.

Identify repeated patterns to predict future price move.

Quantitative Analysis

The Study of technical indicators, which are mathematical interpretations of price volatility and velocity using computer software.

page (1 of )

Charts Types

Tharts are the central tools of the technical analysis, identifying the opening price, the highest price, the lowest price, and the closing price. The PSS trading platform supports the line chart, the bar chart and the candlesticks chart. Almost all traders use candlesticks chart.

Candlesticks chart

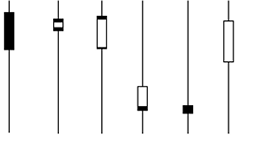
First used by Japanese rice traders in 1800’s, it visually represents bullish candles against bearish candles with open, high, low and close prices. Bullish candles are usually displayed as white or hollow, while bearish candles are black or filled bodies.

One of useful patterns in candlestick chart is the reversal candle, which has long leg and small body.

Such candles, called hammers or stars, show that the market opens and closes near the same point, despite the large volatility, indicating the market is finding balance. When these candles appear after a bullish or bearish move, it often follows with reversal price moves.

Click here to see all candle stick patterns

page (1 of )

Trend Lines and Channels

The most important element of technical analysis is identifying trend lines to define areas of support and resistance.

For an uptrend trend line, connect two previous troughs with a line, and then draw a line parallel to it creating an uptrend channel.

Concept Of Support Area (Line)

The price declines to the level at which it is cheap to buy and expensive to sell, preventing the price from declining further as demand overcomes supply.

To draw a downtrend trend line, connect two previous peaks with a line, and then draw a line parallel to it creating an uptrend channel.

Concept Of Resistance Area (Line)

The price advances to the level at which it is cheap to sell and expensive to buy, preventing the price from rising further as supply overcomes demand.

page (1 of )

Identifying Patterns

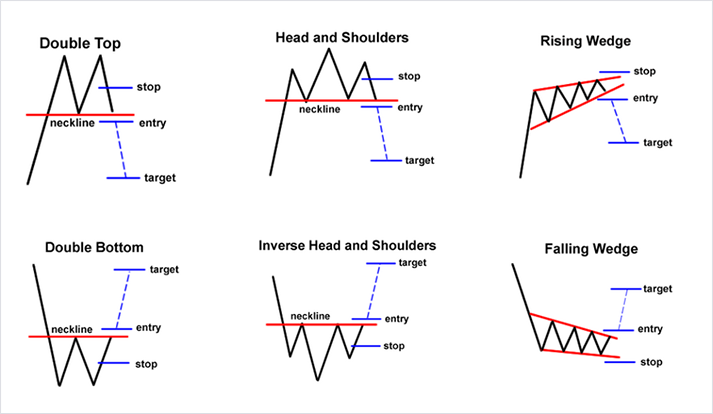
Patterns are easily recognizable price formations on charts.

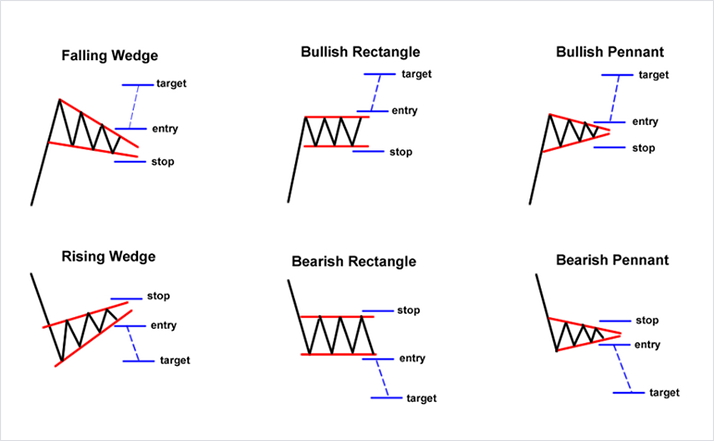
Continuation Patterns indicate a short pause before the trend continues its direction.

Reversal Patterns signify an end of the current trend as a change in direction is about to happen.

Triangle patterns show a balance in demand and supply, so the price can move either way.

page (1 of )

Head and Shoulder

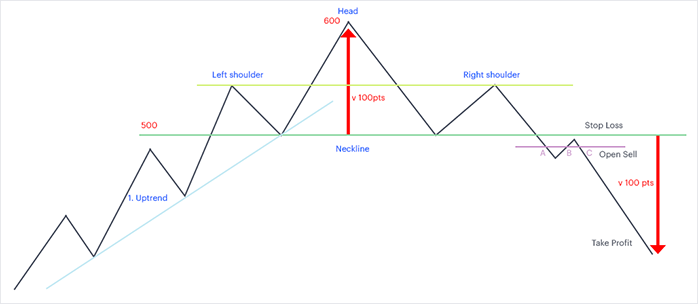
We like head and shoulder pattern best among all patterns. It may be the most complicated and the rarest pattern, but it is also the most reliable pattern from our experience.

Trading plan

We want to enter at the point B when the price retraces back to the neckline. The price is expected to move as much as V, which is from the neckline to the top of head.

Open Sell at 480 (500-20)
Open Sell at 420 (400+20)
Stop Loss at 520 (500+20)

1.Assume the neckline is priced at 500 and the head is priced at 600.
2.The V is 100 point meaning the price will depreciate to 400 from the neckline, 500.
3.We want to take 60% of expected target point so we will take profit of 60 points out of 100 point.
4.We want to use profit and risk ratio of 1.5 to 1 meaning our stop loss will be 40 points.
5.We want to give up 20% on entry and 20% on exit to be sure.

It is important to make sure all provisions for the head and shoulder pattern have been first met.

1.Keep in mind that this is a reversal pattern, so it should have a prior uptrend
2.The size of left and right shoulder should be about the same while the head should be much bigger than shoulders.
3.Check trading volume.
A.Volume for the head is smaller than volume for the left shoulder even with the new high indicating decrease in bullish
momentum.
B.Volume for the right shoulder is again smaller than volume for the head as the price fails to reach the same height.
C.Volume surges to the highest at the breakout point A with or without the volatility in price indicating the battel between demand
and supply.

4.When the price has a clear breakout of the neckline, it completes the head and shoulders pattern. A pullback which does not exceed the neckline validates the head and shoulders area pattern.

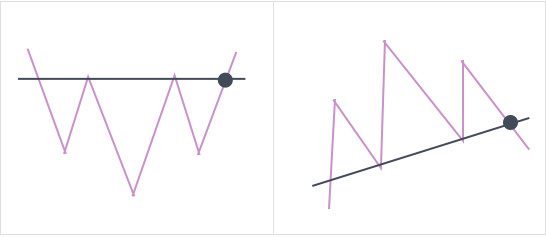
Head and shoulders and its neckline can be tilted or inverted as long as it has all the valid ingredient.

page (1 of )

MOVING AVERAGE (MA)

Trend Follower Technical Indicator

The Moving Average shows the average price value for a specified time period.

Types of moving averages

  • Exponential Moving Average (EMA)
  • Smoothed Moving Average (SMMA)
  • Linear Weighted Moving Average (LWMA)

Exponential and Linear Weighted Moving Averages weigh more value to the recent prices.

The most common way to use MA

  • Buy signal generated when the price rises above its moving average.
  • Sell signal generated when the price falls below its moving average.

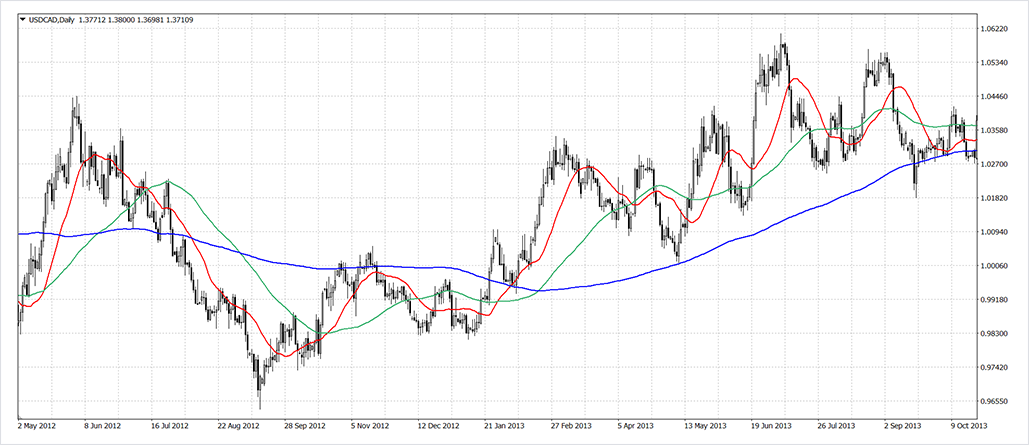
Using MA in a set of three

Create three MA in short, medium, and long terms.

Short term = One month = 20 trading days

Medium term = Three months = 60 trading days

Long term = One year = 200 trading days

  • Buy signal generated when shorter-term MA rises above longer-term MA.
  • Sell signal generated when shorter-term MA falls below its longer-term MA.

Calculation

Simple Moving Average (SMA)

Assume that we are using a 3 day moving average

SMA = SUM(CLOSE, N) / N = (CD1 + CD2+ CD3) / 3day

CD1 = Close price of Day 1

CD2 = Close price of Day 2

CD2 = Close price of Day 3

Exponential Moving Average (EMA)

EMA = (CLOSE(i) * P) + (EMA(i – 1) * (100 – P))

CLOSE(i) — the price of the current period of closure

EMA(i-1) — Exponentially Moving Average of the previous period closure

P — the percentage of using the price value

* Exponential Moving Averages weigh more value to the recent prices.

Smoothed Moving Average (SMMA)

SMMA (i) = (SMMA(i – 1) * (N – 1) + CLOSE (i)) / N

SMMA (i) = The Smoothed Moving Average of The Current Bar

SMMA (i -1) = The Smoothed Moving Average of The Previous Bar

SMMA = SUM(CLOSE, N) / N

N = The Smoothing Period

* Smoothed Moving Averages weigh more value to the recent prices.

Weighted Moving Average (WMA)

WMA = SUM(Close(i)*i, N) / SUM(i, N)

Assume that we are using a 3 day moving average

WMA = (CD1*1 + CD2*2+ CD3*3) / 6day

* Weighted Moving Averages weigh more value to the recent prices.

page (1 of )

STOCHASTIC OSCILLATOR

Resistance or Support Area

The Stochastic Oscillator assesses current prices over the price range in a certain time period. It has two lines, %K in a solid line and %D in a dotted line.

How To Use

Market is considered to be overbought if %K and/or %D rises above 80%.

Market is considered to be oversold if %K and/or %D falls below 20%.

  • Buy when the %K line rises above the %D line under 20%
  • Sell when the %K line falls below the %D line over 80%
  • Look for divergences. If price and stochastic move in opposite directions, the price is likely to change its momentum.

page (1 of )

MOVING AVERAGE CONVERGENCE/DIVERGENCE

Confirming trends and identify reversals.

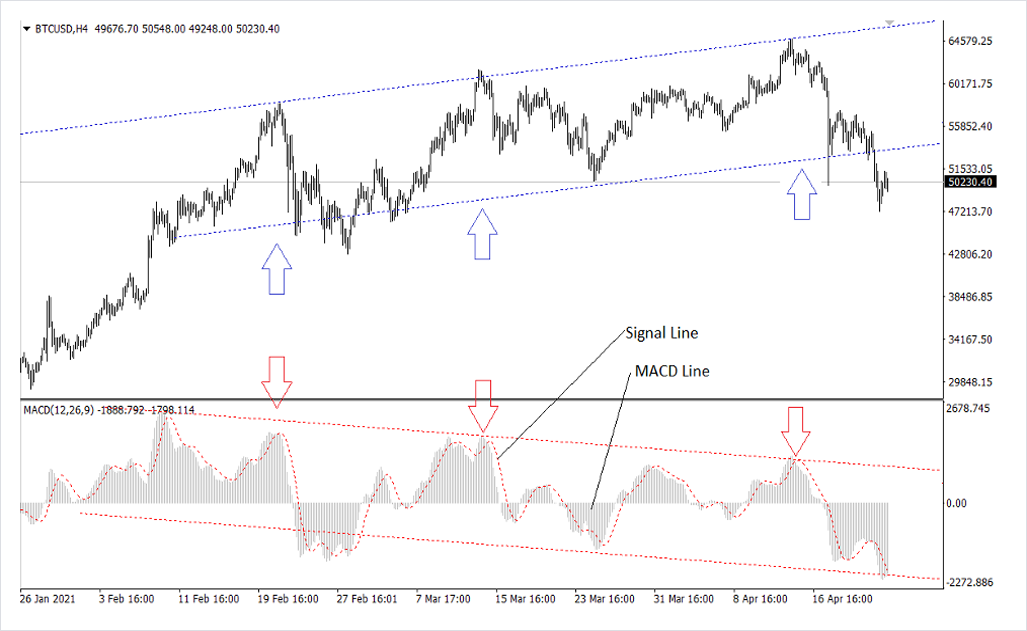
Moving Average Convergence/Divergence (MACD) is a trend-following dynamic indicator. It indicates the correlation between two price moving averages.

MACD the difference between a 26-period and 12-period Exponential Moving Average (EMA). In order to clearly show buy/sell opportunities, a so-called signal line (9-period indicators` moving average) is plotted on the MACD chart.

The MACD proves most effective in wide-swinging trading markets. There are three popular ways to use MACD: crossovers, overbought/oversold conditions, and divergences.

Crossovers

The basic MACD trading rule is to sell when the MACD falls below its signal line. Similarly, a buy signal occurs when the MACD rises above its signal line. It is also popular to buy/sell when the MACD goes above/below zero.

Overbought/oversold conditions

The MACD is also useful as an overbought/oversold indicator. When the shorter moving average pulls away dramatically from the longer moving average (i.e., the MACD rises), it is likely that the security price is overextending and will soon return to more realistic levels.

Divergence

An indication that an end to the current trend may be near occurs when the MACD diverges from the security. A bullish divergence occurs when MACD indicator is making new highs while prices fail to reach new highs. A bearish divergence occurs when the MACD is making new lows while prices fail to reach new lows. Both of these divergences are most significant when they occur at relatively overbought/oversold levels.

Calculation

The MACD is calculated by subtracting the value of a 26-period exponential moving average from a 12-period exponential moving average. A 9-period dotted simple moving average of the MACD (the signal line) is then plotted on top of the MACD.

MACD = EMA(CLOSE, 12)-EMA(CLOSE, 26)

SIGNAL = SMA(MACD, 9)

Where:

EMA

The Exponential Moving Average

SMA

The Simple Moving Average

SIGNAL

The signal line of the indicator

page (1 of )

MONEY FLOW INDEX

Volume Based Technical Indicator

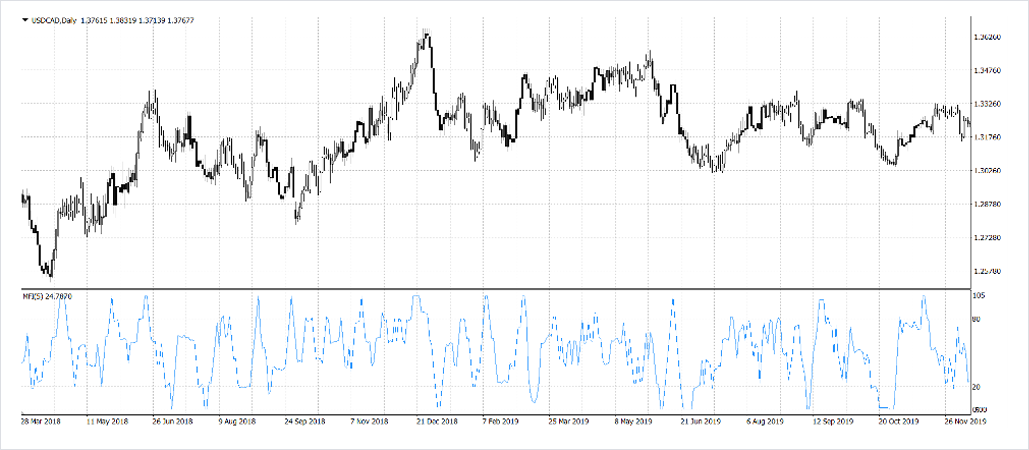
Money Flow Index (MFI) indicates the rate of investment into a security and then withdrawn. The Formula is somewhat similar to Relative Strength Index with volume.

    How We Use It

  • 1.We look for divergences between MFI and chart. If prices and MFI moves in opposite direction, price may change its direction soon;
  • 2.Money Flow Index value over 80 is considered to be the market is fully bought while its value under 20 is considered to be fully sold.

Preferred Parameters

We like to use the 5-trading day for the period.

Calculation

Money Flow Index (MFI) = 100 – (100 / (1 + MR))

Assuming that we set the period as 5 days.

Positive Money Flow (PMF) = A sum of positive MF for the last 5 days

Negative Money Flow (NMF) = A sum of negative MF for the last 5 days

Money Flow (MF) is considered as a positive money flow if Today’s MF is larger than yesterday’s

Money Flow (MF) is considered as a negative money flow if Today’s MF is smaller than yesterday’s

Money Flow (MF) = Typical Price (TP) * Volume

TP=(HIGH + LOW + CLOSE)/3

page (1 of )

Great Job!

If you do not fully understand all concepts, it is ok.

Your real training starts right now.

Here is what you need to do
  • 1. Watch news all the time.
  • 2. Read every newspaper available.
  • 3. Draw trendlines on every chart every day.
  • 4. Most of all, believe in yourself and make a trade.

Trading can be extremely complicated. Arm yourself with the right information. Start putting your intuition to use. Once you have a feel for trading and you have made some gains, and no doubt, experienced some losses, you will develop an understanding of how it all works; not just in terms of numbers, but in terms of the way the market fluctuates.

So now what? Here is what you can do today

1.Click here to access your Trading window.

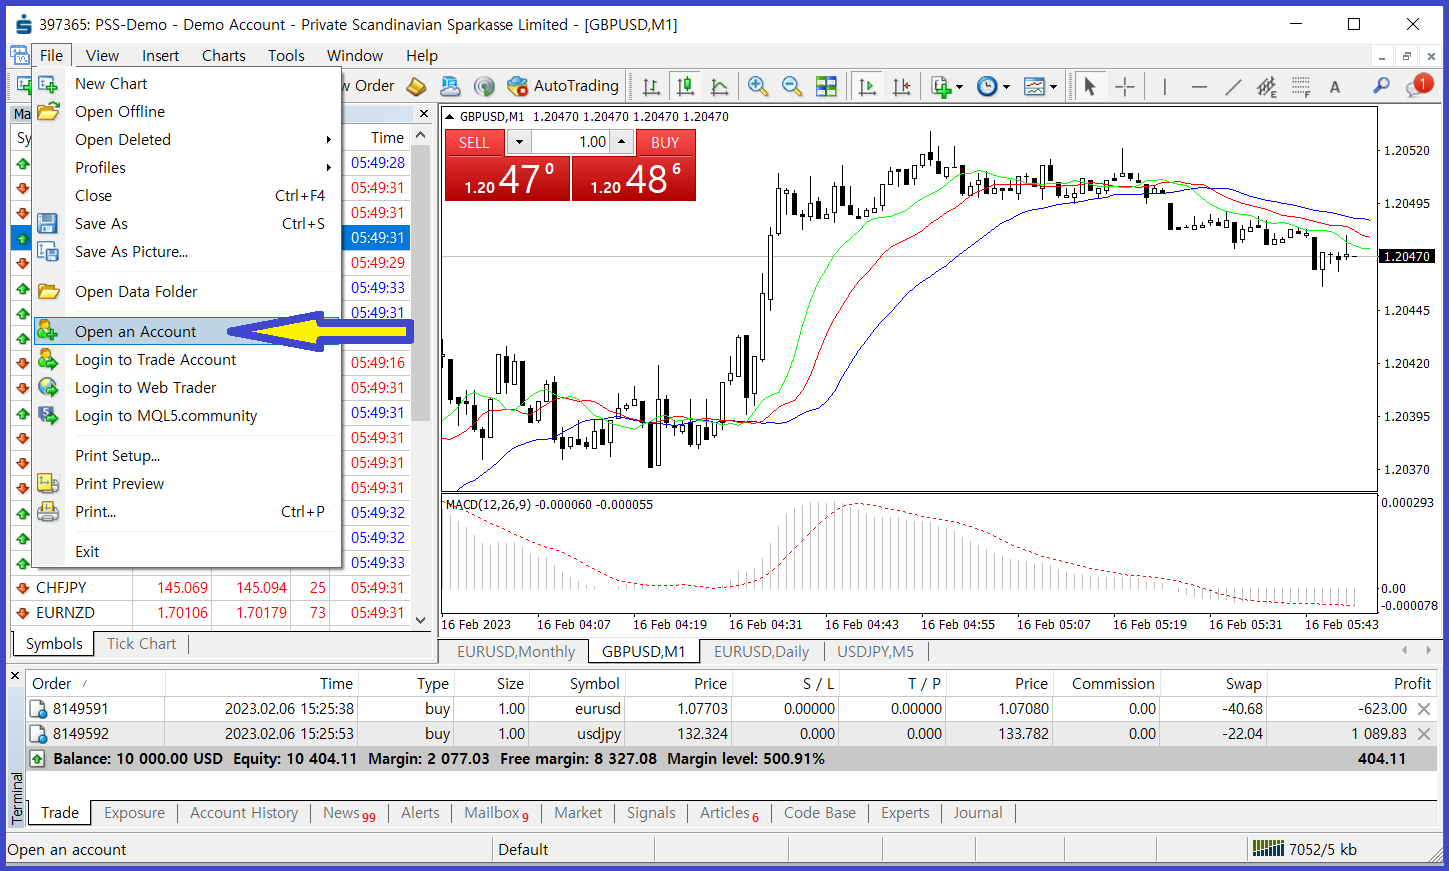
A practice account with $100,000 virtual money should be opened automatically for you. If the practice account is not opened automatically, click ‘Open A Demo Account’ from File menu.

2.Buy a few securities by double clicking symbols in Market Watch window.

Here are some symbols you can start following.

Buy #AAPP

Apple (#AAPP) is the largest and fastest growing company in 21st Century.

Sell #TSLA

Tesla (#TSLA) is the car manufacture, but the company is overvalued compared to its sales growth.

Buy #SPX

S&P 500 (#SPX) consists of largest 500 US companies listed reflecting a general performance of US stock market.

Buy BTCUSD (Bitcoin)

Buying BTCUSD means buying Bitcoin with US Dollar expecting the price of Bitcoin will increase globally.

Buy USDJPY

Buying USDJPY means buying US Dollar and selling Japanese Yen expecting a better US Dollar exchange rate.

Buy XAUUSD (Gold)

Buying XAUUSD means buying Gold and selling US Dollar expecting Gold price will appreciate globally.

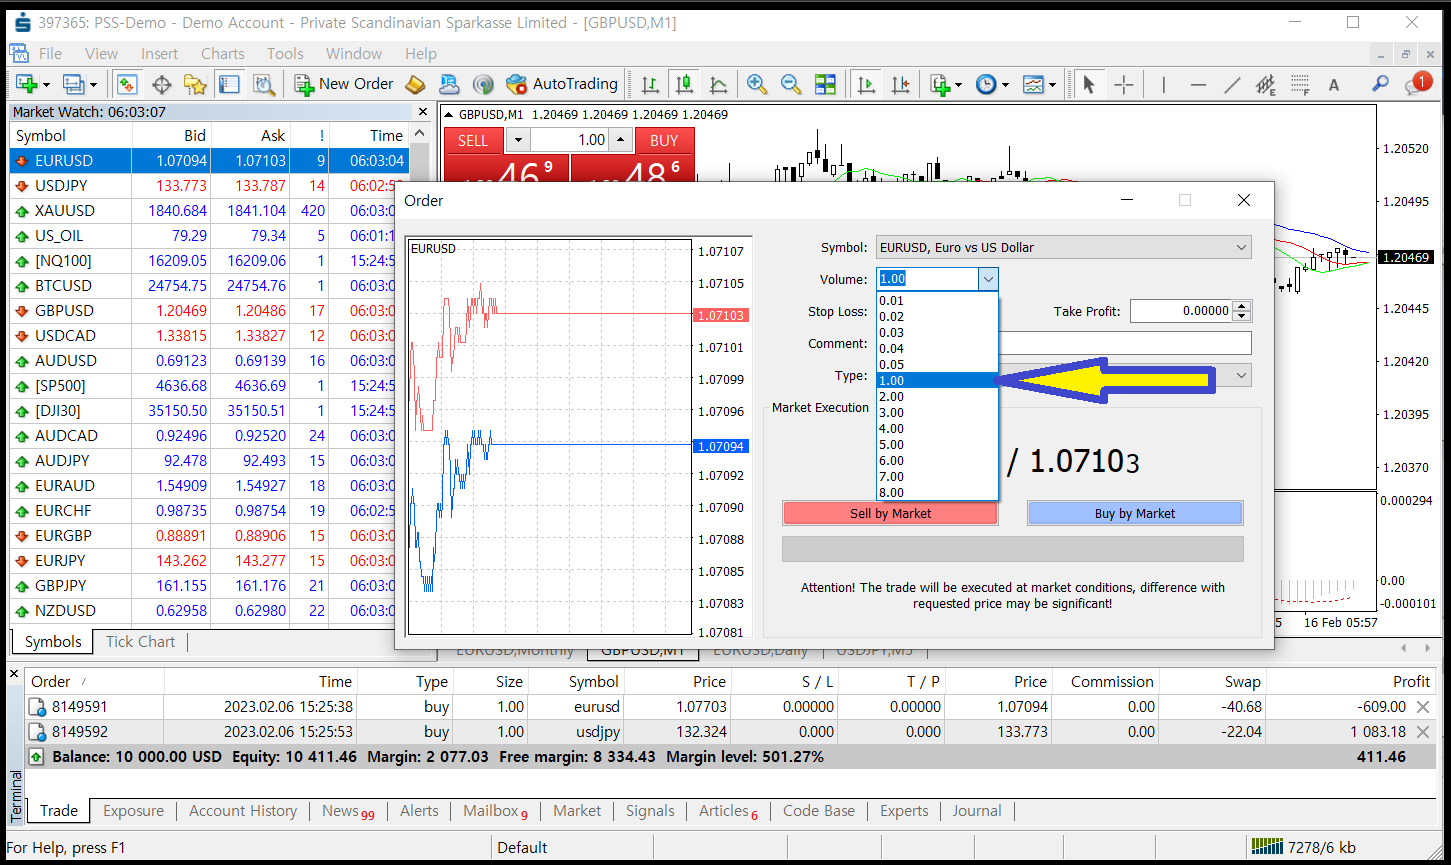
Note: You can also change volume for your trade. See how much profit and loss you make when you trade 1 volume and 10 volume. For most symbols, you can trade as little as 0.01 volume to as high as 3000 volume for certain instruments.

3. Open charts by selecting ‘Chart Window’ menu using right click on symbols in Market Watch window.

4. Now, turn on your TV and start watching news while googling symbols that you have opened.

page (1 of )

Trading Tips

Keep an eye on the news of the world and pay attention to events that might cause an upturn or a downfall in a particular security. Cautiously apply your intuition based on the information you have, then you will gain a better insight into how to make profits next time.

Another thing you need to decide when creating your trading plan is what kind of trader you are. Are you a Day Trader or a Swing Trader? Do you like looking at charts every day, every week, every month or even every year? How long do you want to hold your positions? This will help determine which time frame you will use for your trades. Even though you will still look at multiple time frames, this will be the main time frame you will use when looking for a trade opportunity.

In making of trading plans, it is also important that you define how much you are willing to lose on each trade. Not many people like to talk about losing, but in reality, a good trader thinks about what he could potentially lose before thinking about how much he can win. You have to decide how much room is enough to give your trade some breathing space.

A trading idea on fundamental data

The Non-Farm Payroll has a huge impact on the market especially when the actual data is far off from the consensus estimated. Experienced traders know that such data causes at least 100 pips volatility for US Dollar because large institutions, who forecasted consensus number, often have to readjust their holdings under the new market condition.

n this situation, you can buy the US Dollar if the actual number is better than the consensus, or sell the US Dollar if the actual number is worse than the consensus estimated.

The following is a list of tradable US economic indicators in order of potential profit from trading them in
combination with fundamentals:

  • Non-Farm Payroll
  • Federal Open Market Committee Interest Rate Change Announcement
  • Retail Sales
  • Consumer Confidence 0
  • SM Manufacturing Index
  • Gross Domestic Production (GDP)
  • Durable Goods Orders

A trading idea on technical indicators

One of the common ways to spot a trend reversal is using Moving Averages. A simple a strategy is crossover of 5 day moving average (MA) and 10 day moving average(MA) to identify trend reversals. Another example would be the stochastic lines crossover or MACD lines crossover. The concept on this is that when two lines cross each other, it means that the trend is changing to the opposite direction.

You may also confirm the trend reversal using an additional 20 day MA and wait until 5 day MA crosses 10 day MA (which is the first signal) and continues through 20 day MA (which would be our confirmation for action). Or instead, you could opt for a MACD indicator.

For exits, a trader can either set an amount he or she wants to earn per trade (ex. 25 pips per trade) or use trading tools that help set profit goals (Fibonacci tool, Pivot Points studying). You may also use a logical way to set protective stops in accordance with the market volatility at a given time. For this purpose, you can use the Bollinger Band indicator which generates the so called “corridors” around the price actions. The wider the corridor, the higher is the activity on the market and vice-versa. Measuring the width of the corridor (in pips) at the moment of entering the trade, traders can set up a protective stop out of the range of market fluctuation, and thus protect himself or herself from so called market “noise”.

Calculating Risks in Each Trade

t is an important in trading to know the risks and rewards in each trade. A careful trader will enter the trade only if risks are at least twice lower than the potential rewards (e.g. risk/reward ratio required is 1:2.), while some traders will only consider 1:3 risk/reward ratio to be worth trading. Therefore, before opening a new trading position, you should define the level at which you will take profit or cut loss. Some trading tools like the Fibonacci or Pivot Point studying can give a clue where the profits should be taken and where to be prepared to close the trade.

page (1 of )

Overview

MT4 Trading Platform
The choice for millions of traders around the world

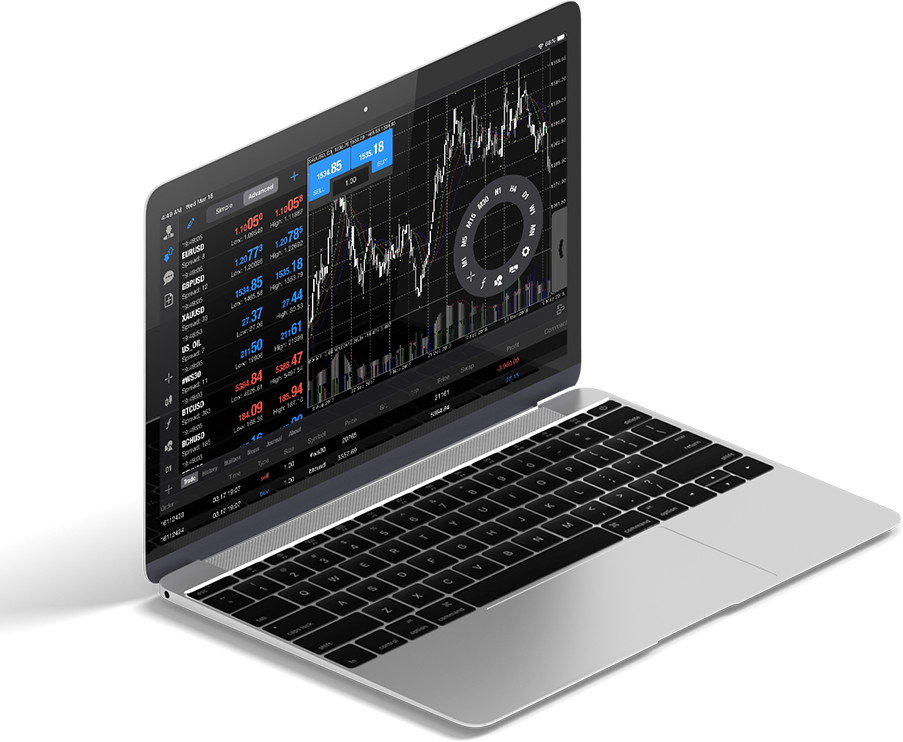
The platform offers advanced trading functions, as well as superior tools for market analysis. MT4(MetaTrader 4) offers automated trading with trading robots and signal trading. In addition, you can access MT4 using any browser, desktop, and mobile device.

page (1 of )

Try risk free practice account

Choose your platform type

MT4 for Window

download

Fast and full access to all trading functions and analytical tools

Only Available for the Windows operating system

MT4 for Trader

Go to WebTrader

Easy access to the market using any internet browser

Limited trading functions and analytical tools

MT4 for Apple

Go to APP Store

Fast and easy trading functions with a great mobility

Limited trading functions and analytical tools

MT4 for Android

Go to Google Play

Fast and easy trading functions with a great mobility

Limited trading functions and analytical tools

page (1 of )

How to Place a Trade

Powerful Trading System MT4 offers
  • Trade any securities from a single platform
  • Use alerts and capture all opportunities right from your mobiles
  • A wide range of orders which can also be placed directly from charts
  • 44 built-in analytical objects for a comprehensive analysis
  • 38 built-in technical indicators for professional technical analysis

page (1 of )
Market Watch Window

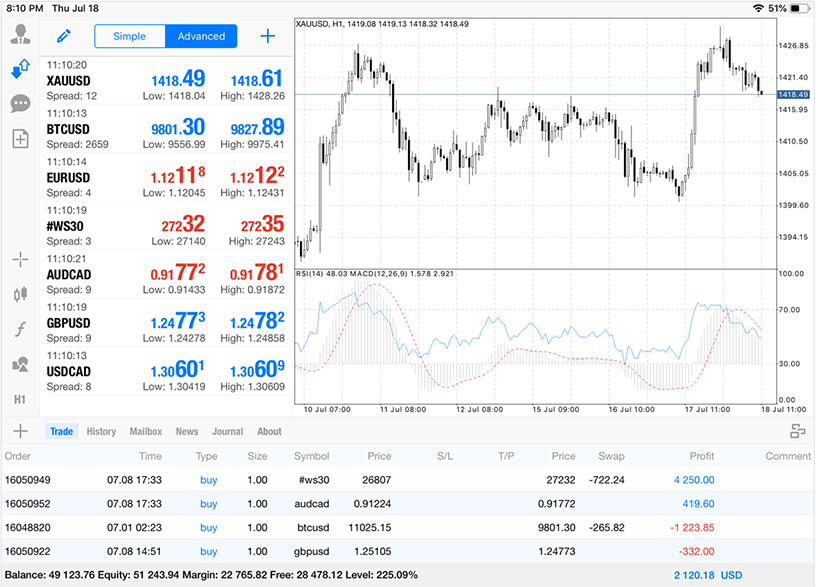
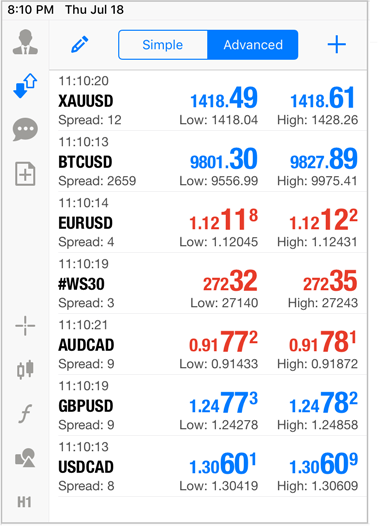
The symbols and quotes are listed in the “Market Watch” window.

This window allows to place market and pending orders and open new charts by tapping or using right mouse button click to show following commends.

Trade opens an order window to place a trade for the symbol selected. See Trade Window.

Chart opens the chart of the symbol selected.

You can also add and delete symbols from market watch window by using below buttons.

This market watch window is from MT4 mobile platform.

page (1 of )
Trade Window

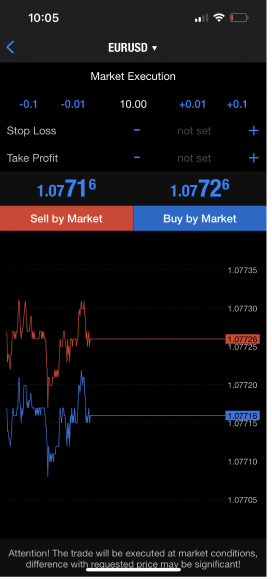
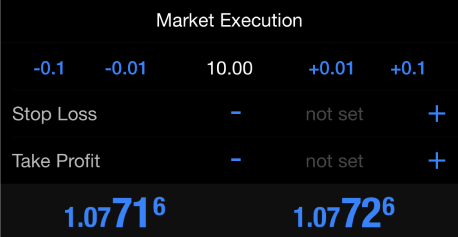
You can open the “Trade” window by tapping or using right mouse button click on symbols from the “Market Watch” window.

Main Order Window

You can place an order to buy or sell at the current market price and set Stop Loss and Take Profit.

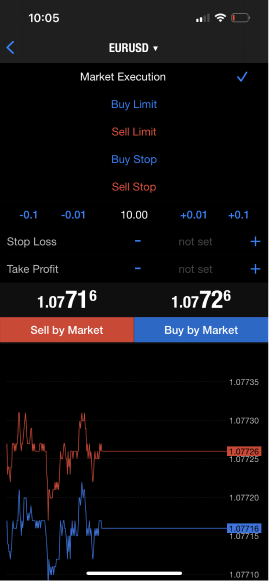
Type of Orders

You have options to choose Market Order and one of the Pending Orders, such as Buy Limit, Sell Limit, Buy Stop and Sell Stop.

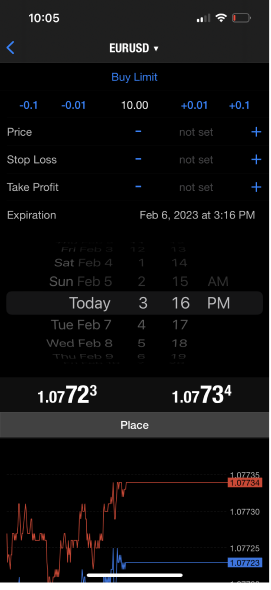
Pending Order Window

You can set an entry price and exit price for your pending orders as well as expiration at which your pending order will be deleted.

page (1 of )
Chart Window

You can open “Chart” and “New Chart” by tapping or using right mouse button click on symbols from “Market Watch” window.

You can open a single chart or multiple charts by clicking the “New Chart” menu

Once a chart is opened you can use the 44 built-in analytical objects and 38 built-in technical indicators for professional and comprehensive technical analysis. These tools are on the left from your trading platforms

page (1 of )
Terminal Window

The “Terminal” window allows control over trading activities, account history, and the system journal.


Trade allow you to see the status of open positions and pending orders, as well as manage all trading activities using a long click or right click on a specific order.

History for all performed trade operations and balance, without taking open positions into consideration, are published here.

Journal lists information about terminal launching and about events during its operation, including all trade operations performed.

page (1 of )

Order types and functions

There are several ways for traders to instruct us to buy and sell any asset or security using trading platform.

Market Order is an instruction for us to buy or sell a security at the current price. Execution of this order results in opening of a trade position. Securities are bought at ASK price and sold at BID price. Stop Loss and Take Profit orders (described below) can be attached to a market order.

Stop Loss Order is used for minimizing of losses in case the security price moves in an unprofitable direction. If the security price reaches Stop Loss level, the position will be closed automatically.

Take Profit Order is intended for gaining the profit when the security price reaches a certain price level. Execution of this order results in closing of the position with profit.

Pending Order is an instruction for us to buy or sell a security at a pre-defined price in the future. This type of orders is used for the opening of a trade position, provided that future quotes reach the pre-defined level. There are four types of pending orders available in the terminal:

Buy Limit

To buy a security at a lower price than the current market price. Traders normally use Buy Limit when they want to wait for market price to drop for better entry.

Buy Stop

To buy a security at a lower price than the current market price. Traders normally use Buy Limit when they want to wait for market price to drop for better entry.

Sell Limit

To sell a security at a higher price than the current market price. Traders normally use Sell Limit when they want to wait for market price to spike for better entry.

Sell Stop

To sell a security at a lower price than the current market price. Traders normally use Sell Stop when they want to confirm bearish momentums of the market before entering.

Orders of Stop Loss and Take Profit can be attached to a pending order. After a pending order has triggered, its Stop Loss and Take Profit levels will be attached to the open position automatically.

page (1 of )

Advanced Trading Tools

PSS offers professional trading tools giving more flexibility for traders and investors to formulate successful trading strategies.

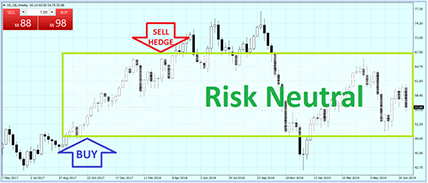
Hedge Trade

Save your positions from being closed out due to margin calls by hedging your trade to be risk neutral on short-term volatility.

One Click Trading

Available with Window system

Place a trade with one click to catch a move in a split of a second.

Trailing Stop

Available with Window system

Lock your profit as your trailing stop adjusts your Stop Loss automatically as the market moves in your favor.

Trading on Chart

Available with Window system

Perform all trading operations right from the chart without opening the order window.

page (1 of )

Hedge Trade

Place a new trade in the opposite direction to an open position to hedge your risk

You can buy and sell a same asset in opposite directions to be risk neutral on market volatility. For example, a trader opens a position to buy 1 million barrels of Crude Oil, but due to a short-term political turbulence, the price of Crude Oil become unpredictable. In this case, the trade can place a hedged trade by selling another million barrels of Crude Oil to be market neutral without taking any margin call risk on short term volatility.

page (1 of )

One click Trading

Don’t miss – ride a move with one click. Available only with Window system.

Enable One Click Trading from a chart in your trading platform to place an order instantly with one click with predefined volume. It is fast, but also dangerous, as your order will be executed without asking for any confirmation. One Click Trade is only available with Windows version PSS MT4. To perform One Click Trading operations directly on a chart, a special panel is available. To activate the panel, execute the “One Click Trading” command in the chart context menu using right-click.

page (1 of )

Trailing Stop

Lock your profit with Trailing Stop. Available only with Window system.

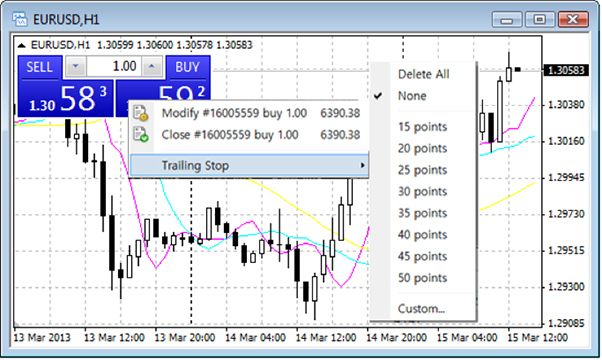
Trailing stop trails a market move in your favor by adjusting Stop Loss order automatically to increase your profit as long as the market move in your favor. When the market changes its momentum and move against your favor, Trailing Stop will no longer adjust your Stop Loss and your open position shall be closed at the highest Stop Loss level that your Trailing Stop placed. Trailing Stop is attached to an open position and works in your trading platform only not in the server like Stop Loss, meaning if you turn off your trading platform, Trailing Stop will no longer adjust Stop Loss.

page (1 of )

Trading On Charts

Perform trading operations right on a chart. Available only with Window system.

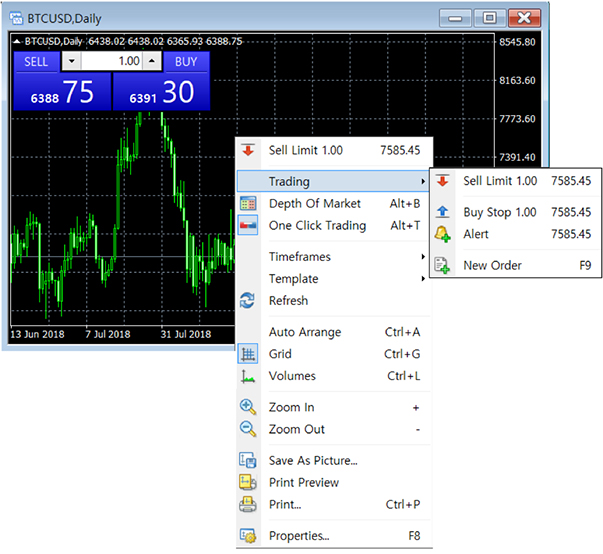
Combined with One Click Trading function, you can open, modify and close positions quickly, as well as manage pending orders. For market order, you can just click “One Click Trading” window. To open a pending order, you can place mouse cursor on the necessary price level on a chart and execute the appropriate command to install a pending order using right click.

According to the cursor’s position, available order types are displayed in the menu.

If the right click menu is activated above the current price, user can place Sell Limit and Buy Stop orders.

If the right click menu is activated below the current price, Buy Limit and Sell Stop orders can be placed.

You can also change price levels for Stop Loss, Take Profit, and Pending orders from a chart. Simply click the price level you want to adjust and drag it to a price you want to change it to. Drop the price level by releasing the mouse button once the cursor is at the required price. When moving a level there is a tooltip displaying potential profit (or loss) and pips that can be obtained if the level triggers.

page (1 of )

Fund Management Tools

Be your own investment house

MT4 Trading Platform allows you to create your own automated trading system as well as copy trades from others with successful trading activities. Using these professional trading and fund management tools, you can perform and enjoy many different type of investment management services for yourself.

Trading Robots

Straight from the platform, you can build and test auto trading robots in visual mode under real market conditions. You can also purchase trading robots built by professional traders and fund managers and use it for your account.

Signal Trading

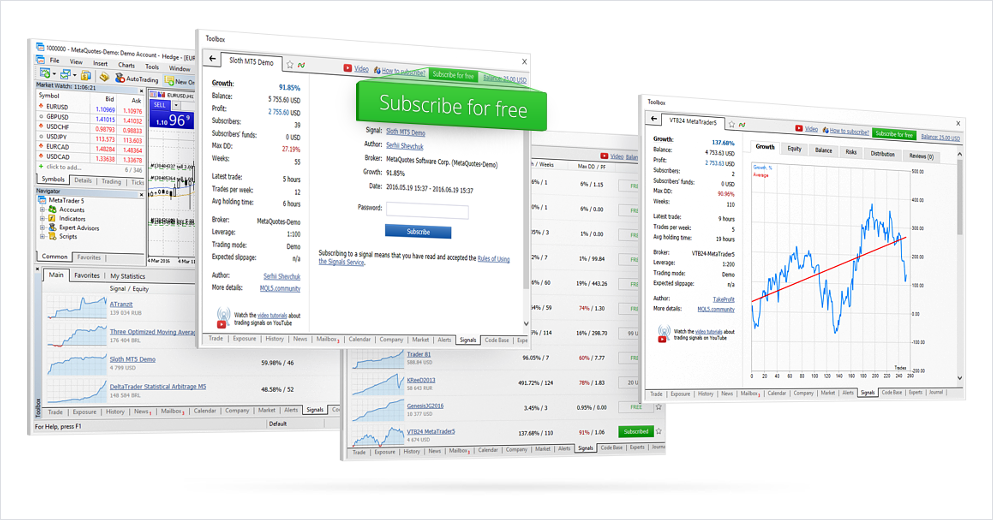
Through MT4 Trading Platform, you are connected to thousands of traders and investors around the world, allowing you to subscribe to trading signals from professional traders and fund mangers and copy their trades in real time.

page (1 of )

TRADING ROBOTS

Put your trading strategies into your trading robot and let it analyze the market and trade for you.

Order trading robots built by professional fund managers with proven track records and let it manage your account for you.

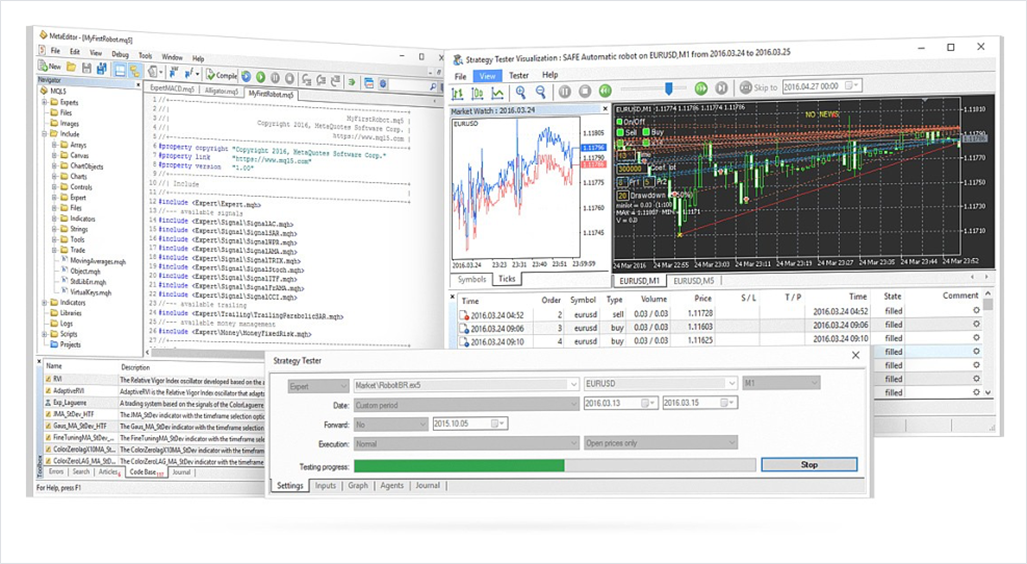
Available on from Window OS system, trading robots feature called Expert Advisor (EA) is one of the most fascinating possibilities provided by MT4 Trading Platform. These applications can analyze the market and perform trading operations in accordance with a specific trading strategy.

page (1 of )

No programming backgrounds?

Use the built-in Wizard to assemble your trading robot using ready-made blocks.

For experienced developers,

C++ based high-level object-oriented programming language available at your disposal.

Test your trading robot

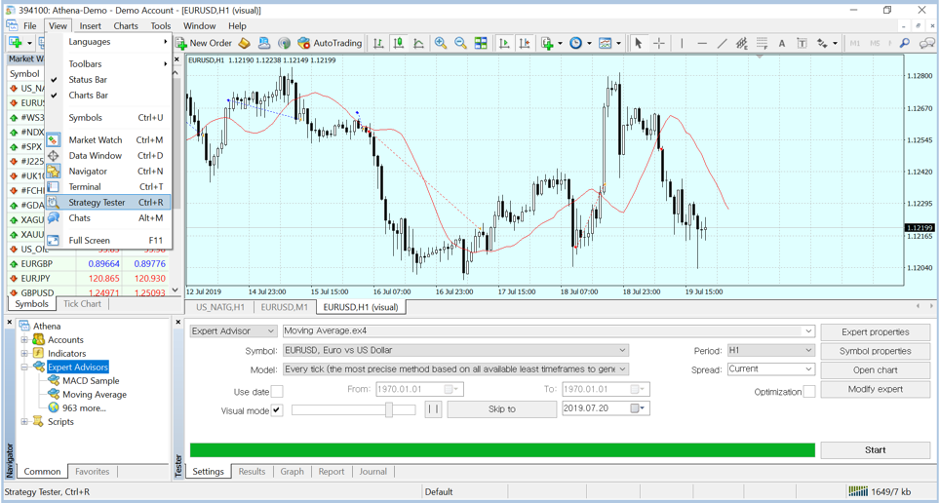
Simply open Strategy Tester from View menu and test and optimize a trading robot before real trading.

page (1 of )

You can test your EA trading robot using risk free demo account with real market prices or you can use the built-in Strategy Tester, which allows you to evaluate the efficiency of a trading robot using historical data directly from your trading platform.

Strategy Tester analyzes historical data over a selected period and performs virtual operations according to its algorithm. Strategy Tester also allows you to test multi-asset trading robots that are capable of analyzing different assets and identifying the correlation between them.

Order your trading robots

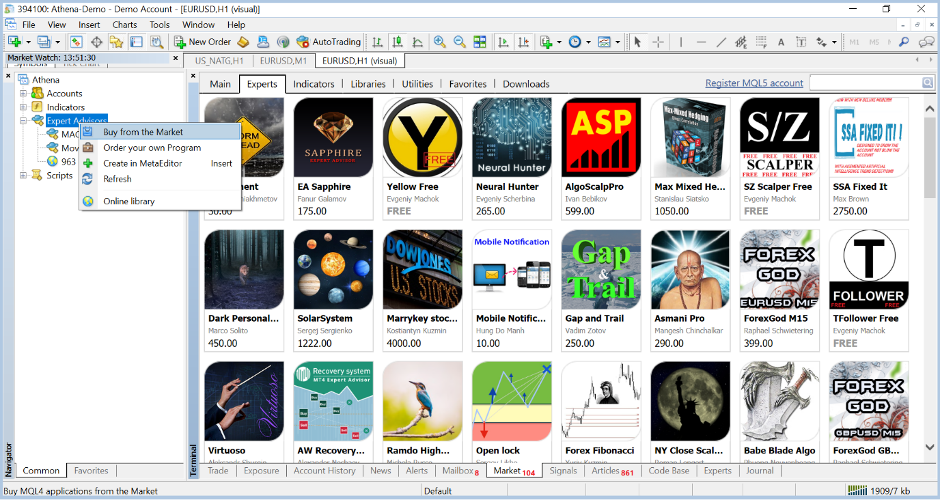
Simply enable right click menu from Expert Advisor in Navigator and buy EA made by professional traders or order your own program to be built by expert EA builders.

page (1 of )
Trading Signals

Simply open Strategy Tester from View menu and test and optimize a trading robot before real trading.

Copy trades of other traders

Available only on Window system, Trading Signals let you copy trades from another account instantly using your MT4 Trading Platform.

How Trading Signal works

Traders provide public access to their trades while others can subscribe to this signal for automatic execution on subscribers’ trading accounts. Here are simple steps to subscribe Trading Singnals.

  • 1.Open “Signal” tap in “Terminal” window from your MT4 Trading Platform.
  • 2.Review and choose a signal that you like from the list sorted by performance and fee.
  • 3.Register to MQL5 and start copying trades from another account in real time.

page (1 of )
Technical Analysis Tools
You need tools to predict future market movements?

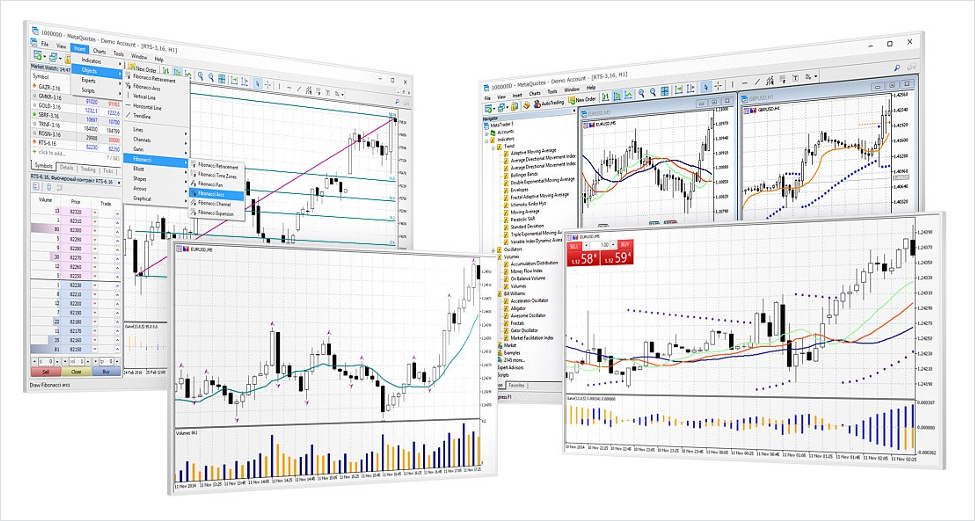
MT4 Trading platform equips traders with the full arsenal of analytical tools for the most thorough price analysis and forecasting.

  • 80 built-in technical indicators and analytical objects
  • 100 charts can be opened to monitor all required financial instruments
  • 21 time-frames to examine short-term price fluctuations along with long-term trends

With the all the exceptional technical analysis tools available in MT4 Trading Platform you can be prepared for any market change!

page (1 of )

What is a contract for difference?

CFD derivative trading allows investors to speculate on fast-moving financial markets (or instruments) at a discounted price. Many professional investors use CFD as a tool to hedge their portfolio as CFD is structured to short sell securities easily. With no stamp duty to pay, CFDs are also tax friendly.

Market Mechanism

With CFD derivative trading, investors buy and sell units of an instrument for underlying asset. Most CFDs are traded on margin, meaning only a small percentage of the full value of the order is required to open a position. Costs to trade CFDs are usually embedded to the spread – the different between buy piece and sell price. However, some CFDs instruments may have commission charges.

Short-selling CFDs in a falling market

CFD trading enables you to sell (short) an instrument if you believe it will fall in value, with the aim of profiting from the predicted downward price move. If your prediction turns out to be correct, you can buy the instrument back at a lower price to make a profit. If you are incorrect and the value rises, you will make a loss. This loss can exceed your deposits.

Hedging your physical portfolio with CFD trading

If you have already invested in an existing portfolio of physical shares with another broker and you think they may lose some of their value over the short term, you can hedge your physical shares using CFDs. By short selling the same shares as CFDs, you can try and make a profit from the short-term downtrend to offset any loss from your existing portfolio.

For example, say you hold £5000 worth of physical ABC Corp shares in your portfolio; you could hold a short position or short sell the equivalent value of ABC Corp with CFDs. Then, if ABC Corp’s share price falls in the underlying market, the loss in value of your physical share portfolio could potentially be offset by the profit made on your short selling CFD trade. You could then close out your CFD trade to secure your profit as the short-term downtrend comes to an end and the value of your physical shares starts to rise again.

Using CFDs to hedge physical share portfolios is a popular strategy for many investors, especially in volatile markets.

page (1 of )

Market Mechanism

With CFD trading, you don’t buy or sell the underlying asset. You buy or sell a number of units for a particular instrument depending on whether you think prices will go up or down. For every point the price of the instrument moves in your favor, you gain multiples of the number of CFD units you have bought or sold.

Margin Trading

All contracts at PSS are leveraged meaning that you only need to deposit a small percentage of the full value of the trade in order to open a position. This is called ‘trading on margin’ (or margin requirement).

No expiration of contract

Unlike Futures Contacts with specific delivery date, CFD does not require a delivery and has no expiration date.

Swap Interest

At the end of each trading day (6pm Central Time), Swap Interest is paid and received between buyers and sellers. The Swap Interest can be positive or negative depending on long or short positions.

page (1 of )

Long CFD Contact

Long CFD allows buyers to anticipate the upside potential of price movement. There is no premium for buyers to pay. Long contact has no expiration date, while opening a long position will require a maintenance margin being withheld based on leverage used. No initial margin is required at PSS.

Example

A trader anticipates appreciation of Bitcoin price against US dollar and places an order to buy 5 BTCUSD contracts.

  • Long 5 Bitcoins and short equivalent USD.
  • Leverage of 100:1 has been used to open trade.
  • The current value of 1 Bitcoin is $11,000

Margin Calculation

Maintenance margin for long 5 Bitcoins.

Margin Requirement = 5 contracts $11,000 (Bitcoin Price) 1/100(leverage) = $550

*In order to buy 5 Bitcoins, the trader needs to have minimum balance of $550.

Profit and Loss Calculation

Bitcoin strengthened against US dollar.

Bitcoin is now traded at $11,200 after 30 minutes of rally.

Profit = ($11,200 – $11,000) * 5 Bitcoins = $1,000.

In Summary

Margin being used: $550

Profit Generated: $1,000

Please note: CFD trades incur a commission charge when the trade is opened.

page (1 of )

Short CFD Contact

Traders can short sell contracts if expecting the Bitcoin value to drop. Here, traders aim to profit from the predicted downward price move. If your prediction turns out to be correct, you can buy the instrument back at a lower price to make a profit.

There is no premium for shorting CFD. Shorting contact has no expiration date while opening a short position will require maintenance margin being withheld based on leverage being used.

Example

A trader anticipates depreciation of Bitcoin price against US dollar and places an order to sell 10 BTCUSD contracts.

  • Short 10 Bitcoins and long equivalent USD.
  • Leverage of 100:1 has been used to open trade.
  • The current value of 1 Bitcoin is $7,000

Margin Calculation

Maintenance margin for long 5 Bitcoins.

Margin Requirement = 10 contracts $7,000 (Bitcoin Price) 1/100(leverage) = $700

*In order to buy 10 Bitcoins, the trader needs to have minimum balance of $700.

Profit and Loss Calculation

Bitcoin strengthened against US dollar.

Bitcoin is now traded at $11,200 after 30 minutes of rally.

Profit = ($7,000 – $6,800) * 10 Bitcoins = $2,000

In Summary

Margin being used: $7010

Profit Generated: $2,000

Please note: CFD trades incur a commission charge when the trade is opened.

page (1 of )

Hedging CFD Contracts

If you own Bitcoins and think that Bitcoin may lose some of its value over the short term, you can hedge your Bitcoins using CFDs. By short selling the same number of Bitcoins as CFDs using a small capital, you can try and make a profit from the short-term downtrend to offset any loss from your existing portfolio.

Example

You own 20 Bitcoins but expect bearish Bitcoin movement and want to hedge the position by selling 10 BTCUSD at PSS.

Hedging Strategy

Sell Bitcoin CFDs to offset any loss may incur on your Bitcoin

  • Sell 20 BTCUSD.
  • Leverage of 100:1 has been used to open trade.
  • The current value of 1 Bitcoin is $15,000

Margin Calculation

Maintenance margin for selling 20 Bitcoins.

Margin Requirement = 20 contracts $15,000 (Bitcoin Price) 1/100(leverage) = $3,000

*In order to buy 20 Bitcoins, the trader needs to have minimum balance of $3,000.

Profit and Loss Calculation

Bitcoin price dropped to $9,000 in 3 months.

Profit = ($15,000 – $9,000) * 20 Coins = $120,000

In Summary

Margin being used: $3,000

Profit Generated: $120,000

Depositing margin of $3,000, you can lock the value of your Bitcoin by hedging them against Bitcoin CFDs.

Using CFDs to hedge physical coins is a popular strategy for many investors, especially in volatile markets.

page (1 of )

Leverage and Margin

What is ‘Leverage’?

Leverage results from using borrowed capital as a funding source when investing to expand one’s asset base and generate returns on risk capital. Leverage is an investment strategy of using borrowed money — specifically, the use of various financial instruments or borrowed capital — to increase the potential return of an investment.

Example

If you borrow 100 Bitcoins with 1 Bitcoin deposit to guarantee any deprecating of value, your leverage is expressed as 1 to 100. On the other hand, if your broker requires you to deposit 10 Bitcoins to borrow 100 Bitcoins, your leverage is 1 to 10.

Using leverage, your profit and loss will also be multiplied. If you make 1% profit in 1 to 1 leverage, your profit will be 100% with 1 to 100 leverage

At PSS, traders can use leverage up to 1 to 300, meaning you can borrow up to 300 Bitcoins with 1 Bitcoin deposit.

What is margin?

Margin is the difference between the total value of securities held in an investor’s account and the loan amount from a broker. Buying on margin is the act of borrowing money to buy securities. The practice includes buying an asset where the buyer pays only a percentage of the asset’s value and borrows the rest from the bank or broker. The broker acts as a lender and the securities in the investor’s account act as collateral.

Example

If your leverage is 1 to 100, you can borrow 100 Bitcoins with 1 Bitcoin deposit to guarantee any deprecating of value. On the other hand, if your leverage is 1 to 10, then you need to deposit at least 10 Bitcoins to borrow 100 Bitcoins.

Required Margin Leverage
5.00% 20:1
3.00% 33:1
2.00% 50:1
1.00% 100:1

At PSS, there is no initial margin, but only maintenance margin is required based on the leverage.

page (1 of )

Margin Call and Stop Out

All orders at PSS are traded on margin starting from as low as 1 to 1 leverage up to 1 to 300 leverage. This leverage system can benefit traders to gain significant profits with a small capital investment, but at the same time, traders can lose more than what they invested with an average market volatility.

To prevent traders from losing more than what they invested, PSS adapts Margin Call and Stop Out. Margin Call is generated in trading platform when available balance falls below the Margin Requirement, alarming traders that any open positions may get liquidated unless additional funds are deposited to the account.

Stop Out is executed automatically when available balance falls below 50% of the Margin Requirement closing any open positions to meet the Margin Requirement and prevent traders lose more than what they invested.

Example of Margin Call and Stop Out

  • A trader expects appreciation of Bitcoin price in the US
  • A position buying 10 USDBTC is opened
  • Leverage of 1:100 is used to open the position
  • The price of Bitcoin was $9,000 in the US when the position is opened.
  • The balance in the trader’s account was $2,500
  • No other positions were opened.

Total value of the opened position = $9,000 * 10 Bitcoins = $90,000

Margin Requirement for 10 Bitcoins = $90,000 * 1/100 = $900

The trader’s required margin to open 10 Bitcoins using leverage of 1 to100 is $900. In this case, Margin Call will be generated if the available balance falls below $900 and Stop Out will be initiated if the available balance falls below $450.

Case 1. Bitcoin price drops 2% by $180.

The current Bitcoin Price = $8,820

Total value of the opened position = $8,820* 10 Bitcoins = $88,200

Unrealized Loss = $90,000 – $88,200 = $1,800

Available Balance = $2500 – $1,800 = $700

Case 2. Bitcoin price drops 3% by $270.

The current Bitcoin Price $8,820

Total value of the opened position = 8,730* 10 Bitcoins = $87,300

Unrealized Loss = $90,000 – $87,300 = $2,700

Available Balance = $2500 – $2,700 = – $200

In this case, Stop Out is initiated and the positions will be liquidated as the available balance falls below the 50% of the required margin which is $450. The Stop Out prevents the trader going to a negative balance and the trader’s new account balance now is $450 after the Stop Out.

When a market is extremely volatile, there is a chance that PSS cannot close the order in Stop Out level because there is no seller in the market at the time. In such case, bankruptcy on the account is declared and Stop Out shall not be honored as explain above resulting bigger loss for the trader..

page (1 of )

Swap Interest

The Swap Interest is charged once a day only if there is an open position when CME(Chicago Mercantile Exchange) open its futures trading at 6pm Central Time (UTC – 6) every day. If there is no open position at 6pm CT, no Swap Interest will be charged.

Swap Interest calculation formula

Swap interest for a long position = The Interest Rate Contract Premium / 360

Swap interest for a short position = The Interest Rate Contract discount / 360

In trading CFD, whether you buy or sell a contract, you borrow the same amount of fund in value regardless of base currency or quote currency. For example, if you buy 1 unit of Bitcoin contract at a price of $10,000, you are borrowing 1 Bitcoin worth $10,000. If you sell 1 unit of Bitcoin contact, you are borrowing $10,000 worth 1 Bitcoin. Therefore, swap interest for buying and selling CFD should be the same. However, premium is added to swap interest for buying cryptocurrency CFD due to volatile characteristic of cryptocurrencies while discount is given for borrowing fiat currencies such as US dollar.

When trading cryptocurrency against another cryptocurrency, such as buying Bitcoin against Ethereum, you are borrowing cryptocurrency for buying and selling the contact. Therefore premium is added for long and short positions.

page (1 of )

Interest Rate Cap

Interest rate cap is a derivative in which the buyer receives payments at the end of each period in which the interest rate exceeds the agreed strike price. PSS use Interest Rate Cap to protect traders from any sudden surge in swap interest causing unavoidable disruption in trading.

For all trades at PSS, Interest rate cap is set at 0.3% and if ever swap interest and premium spikes above 0.3%, any exceeding interest will be paid back to the position.

Example

Swap Interest spikes to 0.55% on Bitcoin due to a rapid appreciation of Bitcoin pricing at $20,000 currently. In this case, interest rate cap is activated at the strike price of 0.3%, and the exceeding interest will be paid back to the position.

$20,000 ·1 day · max (0.55%-0.3%, 0) = $50

$50 will be paid back to the trade.

On every Wednesday at 6pm UTC-6, an extra two days of swap interest are charged to any open trades to cover swap interest over the weekend, since all contracts take two days to settle. This means that if a position is still opened after the market closes on Wednesday, such orders will not be settled until the following Monday.

page (1 of )

Trading CFDs At PSS

Whether you are a new or experienced CFD trader, our award-winning trading platform and service offers you:

Reliable Platform

Our platform can handle over one million prices per second tested for more than 10 years.

Swap Interest Cap

Swap interest is capped at 0.3% at all market conditions.

Advanced Trading Tools

You can trade faster and easier than before. All you need in trading is here at PSS.

Real time deposit and withdraw

All deposits and withdraws are completed within 30 minutes.

Contract for difference (CFD) is a popular form of derivative trading for European traders and investors. CFD trading enables traders to speculate on the rising or falling prices of fast-moving global financial markets (or instruments) such as cryptocurrencies, shares, indices, commodities, currencies and treasuries.

Traders at PSS can trade cryptocurrency contracts without owning actual coins. Therefore, commission is low since PSS does not incur carrying cost of storing and delivering actual coins for trading. Moreover, there is no expiry on the contracts since no delivery is required.

All contracts bought and sold in PSS can be leveraged up to 1 is to 300, meaning you can own 300 Bitcoins at the price of 1 Bitcoin. Overnight swap interest to cover borrowing cost for leverage is charged only if a position is opened when the futures market starts trading in Chicago at 6pm Central Time (UTC-6 hours).

Short selling is available at PSS enabling traders to sell coins without owning them, while Hedge trading allows traders to buy and sell the same coin without closing the other, protecting themselves against any market volatility.

page (1 of )

What is Futures Market?

A futures market is an auction market in which participants buy and sell commodity and futures contracts for delivery on a specified future date. Major futures markets are the New York Mercantile Exchange, the Chicago Mercantile Exchange, the Chicago Board Options Exchange, Dubai Mercantile Exchange, and ICE Futures Europe.

Originally, such trading was carried on through open yelling and hand signals in a trading pit, though in the 21st century, like most other markets, futures exchanges are mostly electronic.

The Basics of a Futures Market

In order to understand fully what a futures market is, it’s important to understand the basics of futures contracts, the assets traded in these markets.

Futures contracts are made in an attempt by producers and suppliers of commodities to avoid market volatility. These producers and suppliers negotiate contracts with an investor who agrees to take on both the risk and reward of a volatile market.

Futures markets or futures exchanges are where these financial products are bought and sold for delivery at some agreed-upon date in the future with a price fixed at the time of the deal. Futures markets are for more than simply agricultural contracts, and now involve the buying, selling and hedging of financial products and future values of interest rates.

Futures contracts can be made or “created” as long as open interest is increased, unlike other securities that are issued. The size of futures markets (which usually increase when the stock market outlook is uncertain) is larger than that of commodity markets, and are a key part of the financial system.

Futures Market Example

For instance, if an oil producer sells oils at $50 per barrel to an oil refinery who transforms and refines crude oil into more useful products such as gasoline, diesel fuel, and heating oil, and the oil refinery sells that refined oil at $100 per barrel and both are making a profit at that price, they’ll want to keep those costs at a fixed rate. The investor agrees that if the price for oil goes below a set rate, the investor agrees to pay the difference to the oil producer.

If the price of oil goes higher than a certain price, the investor gets to keep profits. For the oil refinery, if the price of oil goes above an agreed rate, the investor pays the difference and the oil refinery gets the oil at a predictable rate. If the price of oil is lower than an agreed-upon rate, the oil refinery pays the same price and the investor gets the profit.

page (1 of )

Futures Contract

A futures contract is a legal agreement to buy or sell a particular commodity, currency, asset, or cryptocurrency at a predetermined price at a specified time in the future. Futures contracts are standardized for quality and quantity to facilitate trading on a futures exchange. The buyer of a futures contract is taking on the obligation to buy the underlying asset when the futures contract expires. The seller of the futures contract is taking on the obligation to provide the underlying asset at the expiration date.

How Do Futures Contracts Work?

“Futures contract” and “futures” refer to the same thing. For example, you might hear somebody say they bought oil futures, which means the same thing as an oil futures contract. When someone says “futures contract,” they’re typically referring to a specific type of future, such as oil, gold, or currency futures. The term “futures” is more general and is often used to refer to the whole market, such as “They’re a futures trader.”

Example of Futures Contracts

Futures contracts are used by two categories of market participants: hedgers and speculators. Producers or purchasers of an underlying asset hedge or guarantee the price at which the commodity is sold or purchased, while portfolio managers and traders may also make a bet on the price movements of an underlying asset using futures.

An oil producer needs to sell their oil. They may use futures contracts do it. This way they can lock in a price they will sell at, and then deliver the oil to the buyer when the futures contract expires. Similarly, a manufacturing company may need oil for making widgets. Since they like to plan ahead and always have oil coming in each month, they too may use futures contracts. This way they know in advance the price they will pay for oil (the futures contract price) and they know they will be taking delivery of the oil once the contract expires.

Futures are available on many different types of assets. There are futures contracts on cryptocurrency, commodities, and currencies.

Mechanics of a Futures Contract

Imagine an oil producer plans to produce one million barrels of oil over the next year. It will be ready for delivery in 12 months.

Assume the current price is $75 per barrel. The producer could produce the oil, and then sell it at the current market prices one year from today.

Given the volatility of oil prices, the market price at that time could be very different than the current price.

If oil producer thinks oil will be higher in one year, they may opt not to lock in a price now. But, if they think $75 is a good price, they could lock-in a guaranteed sale price by entering into a futures contract.

A mathematical model is used to price futures, which takes into account the current spot price, the risk-free rate of return, time to maturity, storage costs, dividends, dividend yields, and convenience yields. Assume that the one-year oil futures contracts are priced at $78 per barrel. By entering into this contract, in one year the producer is obligated to deliver one million barrels of oil and is guaranteed to receive $78 million. The $78 price per barrel is received regardless of where spot market prices are at the time.

Contracts are standardized. For example, one oil contract on the Chicago Mercantile Exchange (CME) is for 1,000 barrels of oil. Therefore, if someone wanted to lock in a price (selling or buying) on 100,000 barrels of oil, they would need to buy/sell 100 contracts. To lock in a price on one million barrels of oil/they would need to buy/sell 1,000 contracts.

page (1 of )

How to Trade Futures Contracts

Retail traders and portfolio managers are not interested in delivering or receiving the underlying asset. A retail trader has little need to receive 1,000 barrels of oil, but they may interested in capturing a profit on the price moves of oil.

Futures contracts can be traded purely for profit, as long as the trade is closed before expiration. Many futures contracts expire on the third Friday of the month, but contracts do vary so check the contract specifications of any and all contracts before trading them.

For example, it is January and April contracts are trading at $55. If a trader believes that the price of oil will rise before the contract expires in April, they could buy the contract at $55. This gives them control of 1,000 barrels of oil. They are not required to pay $55,000 ($55 x 1,000 barrels) for this privilege, though. Rather, the broker only requires an initial margin payment, typically of a few thousand dollars for each contract.

The profit or loss of the position fluctuates in the account as the price of the futures contract moves. If the loss gets too big, the broker will ask the trader to deposit more money to cover the loss. This is called maintenance margin.

The final profit or loss of the trade is realized when the trade is closed. In this case, if the buyer sells the contract at $60, they make $5,000 [($60-$55) x 1000). Alternatively, if the price drops to $50 and they close out the position there, they lose $5,000.

page (1 of )

Futures Exchange

A futures exchange is a diverse marketplace where commodities futures, cryptocurrency futures, and options on futures contracts are bought and sold. Those who are allowed access to the exchange are brokers and commercial traders who are members of the exchange. Individuals who want to trade futures contracts must do so by having an account with a registered broker. Futures exchanges also provide clearing and settlement functions.

Key Takeaways

  • Futures exchanges allow people who want to trade commodities the ability to quickly find each other and safely trade.
  • Access to the exchange is available only to member firms and individuals.
  • Individuals who want to trade must do so through a broker firm who is a member of the exchange.
  • Exchanges also provide clearing services.

How a Futures Exchange Works

The function of a futures exchange is to standardize and promote futures trading for as many participants as possible. The incentive mechanisms for those who run the exchange are roughly based on the volume and dollar value of what is traded—the more the better. That means they work to bring in as many participants making as many trades as is possible. This has led to many innovations in recent years, driving increased participation through electronic networks.

Where a futures exchange used to have an important physical presence, such as the trading floors in the Chicago Mercantile Exchange (CME) or the New York Mercantile Exchange (NYMEX), it is no longer true that these locations hold as much meaning as they once did. Since trading can happen from the computer of anyone connected through the internet to an exchange-member broker, trading is decentralized around the world and happens nearly 24 hours a day during the week.

Futures traded on a futures exchange allow the sellers of the underlying commodities the certainty on the price they will receive for their products at the market. At the same time, the exchange will enable consumers or buyers of those underlying commodities the certainty of the price they will pay, at a defined time in the future.

To encourage as much participation and liquidity as possible, contracts trading on an exchange have standardized sizes, expiration dates, and, for options, strike prices. Exchanges also provide pricing information, disseminated by information vendor firms. Information sharing allows for transparency in activities and fairness to all. Pricing information, including price, bids, and offers, is available to all interested institutions and individuals equally, no matter their size.

A Short History of Futures Exchanges

The largest futures exchange, the Chicago Mercantile Exchange, was formed in the late 1890s when the only futures contracts offered were for agricultural products. The emergence of interest rate, or bond futures, and currency futures in major foreign exchange markets came in the 1970s. Today’s futures exchanges are significantly larger, with hedging of financial instruments via futures. These futures hedging contracts comprise the majority of the futures market activity. Futures exchanges play an important role in the operation of the global financial system.

Financial exchanges saw many mergers, with the most significant being between the Chicago Mercantile Exchange and the Chicago Board of Trade (CBOT) in 2007. Rebranded as the CME Group, it then acquired NYMEX Holdings, Inc., the parent of the New York Mercantile Exchange (NYMEX) and Commodity Exchange, Inc (COMEX) in 2008. Growing again in 2012, it added the Kansas City Board of Trade, who is the dominant player in hard red winter wheat.

Another major player in the U.S. is the Intercontinental Exchange (ICE). Born as an electronic exchange in 2000, ICE acquired the International Petroleum Exchange (IPE) in 2001. In 2007, it obtained both the New York Board of Trade (NYBOT) and the Winnipeg Commodity Exchange (WCE). Finally, it expanded into equities with the acquisition of NYSE Euronext in 2013.

page (1 of )